Carry
out experiments in each of the modes you select that show how the human work
output depends upon time. Does this quantity depend upon the power level selected?
Does cooling of the power system influence the outcome?
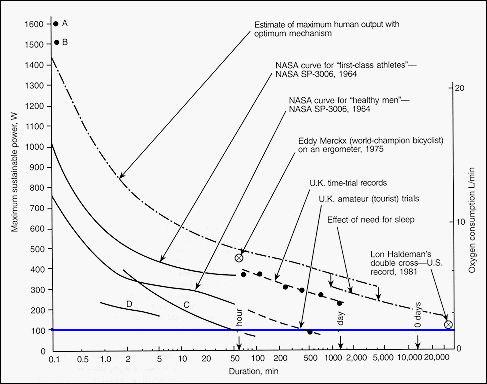
The diagram
displays data compiled with foot cranking systems for the maximum sustainable
power output of a "warmed-up" person as a function of the duration
(logarithmic scale) of the activity. Take data on your own performance
in each selected mode and plot it in the way displayed on this graph.
|
